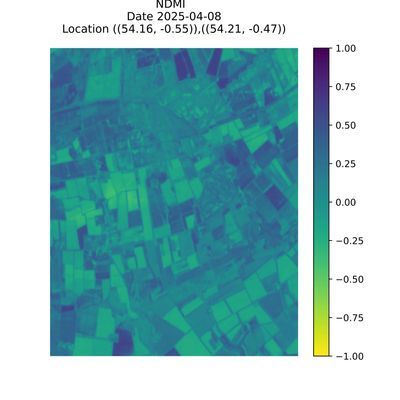
Home
Indices
  • NDVI
  • NDMI
  • GCI
  • RECI
Data Attributes
Location
  • Ordnance Survey Grid
  • Latitude & Longitude
Service & Pricing

Satellite Data with
Terrasat Analytics

Satellite Data with Terrasat AnalyticsSatellite Data with Terrasat AnalyticsSatellite Data with Terrasat Analytics
Home
Indices
  • NDVI
  • NDMI
  • GCI
  • RECI
Data Attributes
Location
  • Ordnance Survey Grid
  • Latitude & Longitude
Service & Pricing
More
  • Home
  • Indices
    • NDVI
    • NDMI
    • GCI
    • RECI
  • Data Attributes
  • Location
    • Ordnance Survey Grid
    • Latitude & Longitude
  • Service & Pricing

Satellite Data with
Terrasat Analytics

Satellite Data with Terrasat AnalyticsSatellite Data with Terrasat AnalyticsSatellite Data with Terrasat Analytics
  • Home
  • Indices
    • NDVI
    • NDMI
    • GCI
    • RECI
  • Data Attributes
  • Location
    • Ordnance Survey Grid
    • Latitude & Longitude
  • Service & Pricing

NDMI

NDMI (Normalized Difference Moisture Index)

  The Normalized Difference Moisture Index (NDMI) detects moisture levels in vegetation using a combination of near-infrared (NIR) and short-wave infrared (SWIR) spectral bands. SWIR band reflects changes in both the vegetation water content and the spongy mesophyll structure in vegetation canopies, while the NIR reflectance is affected by leaf internal structure and leaf dry matter content but not by water content. The combination of the NIR with the SWIR removes variations induced by leaf internal structure and leaf dry matter content, improving the accuracy in retrieving the vegetation water content. The amount of water available in the internal leaf structure largely controls the spectral reflectance in the SWIR interval of the electromagnetic spectrum. SWIR reflectance is therefore negatively related to leaf water content. 

It is a reliable indicator of water stress in crops. 


The NDMI values have been calculated using the following equation:


  • NDMI = (NIR – SWIR) / (NIR + SWIR) 


The NDMI range is normalised and between -1 to +1. 

The colour map used for NDMI is shown to the right of the image.

The data is available at 20 metre resolution.

Copyright © 2025 TerraSat Analytics - All Rights Reserved.

Powered by

  • Privacy Policy
  • Terms and Conditions

This website uses cookies.

We use cookies to analyze website traffic and optimize your website experience. By accepting our use of cookies, your data will be aggregated with all other user data.

DeclineAccept