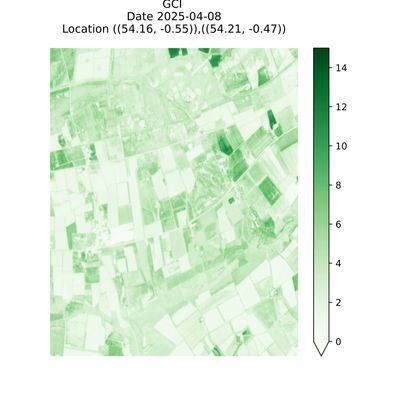
Home
Indices
  • NDVI
  • NDMI
  • GCI
  • RECI
Data Attributes
Location
  • Ordnance Survey Grid
  • Latitude & Longitude
Service & Pricing

Satellite Data with
Terrasat Analytics

Satellite Data with Terrasat AnalyticsSatellite Data with Terrasat AnalyticsSatellite Data with Terrasat Analytics
Home
Indices
  • NDVI
  • NDMI
  • GCI
  • RECI
Data Attributes
Location
  • Ordnance Survey Grid
  • Latitude & Longitude
Service & Pricing
More
  • Home
  • Indices
    • NDVI
    • NDMI
    • GCI
    • RECI
  • Data Attributes
  • Location
    • Ordnance Survey Grid
    • Latitude & Longitude
  • Service & Pricing

Satellite Data with
Terrasat Analytics

Satellite Data with Terrasat AnalyticsSatellite Data with Terrasat AnalyticsSatellite Data with Terrasat Analytics
  • Home
  • Indices
    • NDVI
    • NDMI
    • GCI
    • RECI
  • Data Attributes
  • Location
    • Ordnance Survey Grid
    • Latitude & Longitude
  • Service & Pricing

GCI

GCI (Green Chlorophyll Index)

  The chlorophyll index (CI) is applied to calculate the total amount of chlorophyll in plants. In general, this index contains two separate bands: CIgreen and CIred-edge. These bands are responsive to slight variations in the chlorophyll content and are consistent for most types of plants. In other words, the CI is a relatively accurate indicator of plant health and can be effectively used in nutrient management throughout the season. 


The green chlorophyll index’s (CIgreen Or GCI) main strength is that it can be successfully used for a wide range of plant species. GCI index is calculated as a ratio of the chlorophyll’s reflectance in the NIR band over the reflectance in the green band using the following equation:


  • GCI = (NIR /GREEN) - 1


The GCI values are not normalised. Typically the range of values is between 0 and 15 however values can fall outside this range. Any values which are outside of this ranges will be shown in the values for either 0 or 15. An arrow at the end of the colour map denotes values outside of the range have been found in this instance.

The colour map used for GCI is shown to the right of the image.

The data is available at 20 metre resolution.

Copyright © 2025 TerraSat Analytics - All Rights Reserved.

Powered by

  • Privacy Policy
  • Terms and Conditions

This website uses cookies.

We use cookies to analyze website traffic and optimize your website experience. By accepting our use of cookies, your data will be aggregated with all other user data.

DeclineAccept