Data Attributes
Image Size
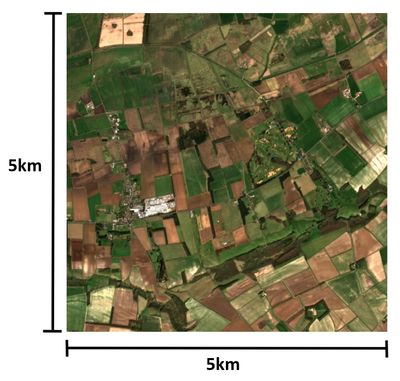
All images represent approximately a 5 km by 5 km square where the location of the image is provided by using both the ordnance survey national grid reference and latitude and longitude coordinates.
Image Granularity
The data we extract for True Colour and NDVI images have a spatial resolution of 10 metres. This means that 1 dot represents 10 m^2 of land.
The data we extract for NDMI and the chlorophyll indices (CI) have a spatial resolution of 20 metres. This means that 1 dot represents 20 m^2 of land.
File Naming Convention
All images are downloaded in JPEG format.
The filenames use the following format:
- Image type which are either True Colour, NDVI, NDWI, GCI or RECI
- Location using ordnance survey national grid reference letters and 2 digits and a quarter reference from 1 to 4
- Date the image was taken given in the following format YYYY-MM-DD
- File extension which is JPEG
Example filenames:
- True Colour SE63 1 2024-05-12.jpeg
- NDVI TQ23 4 2024-05-12.jpeg
Temporal Resolution
The temporal resolution of a satellite in orbit is the revisit frequency of the satellite to a particular location. For the Sentinel-2 satellites the revisit frequency is every 2 to 3 days. The exact date will depend upon the location of the land. After the data is captured by the satellite it is downloaded from space and undergoes pre-processing on the Copernicus platform. We will aim to make the data available to you as soon as possible once it is publicly available.
The date that the image was taken is shown in the file name and on the image in the following format YYYY-MM-DD i.e. 2025-04-11 which is the 11th April 2025.
We can provide historic data from up to 2017 upon request.

Cloud Coverage
Cloud Coverage
Satellite images are taken above the cloud line and it is impossible to predict the level of cloud coverage on the day that the satellites pass overhead. If cloud coverage exceeds 30% then we do not extract the image as much of the detail will be missing. If an image is missing for a particular date, then it is due to the poor data quality.
Colour Maps
Colour maps are essential tools for satellite imagery because they translate complex numerical data into visual formats that are easier to interpret. Colour maps assign difference colour to represent different features in the data. Colour maps can be used to emphasize different features such as terrain, vegetation, water bodies, urban areas, etc. The colour maps applied to each index are shown at the right hand side of the image.
